Overview
Discover most advanced features of Slurm-web.
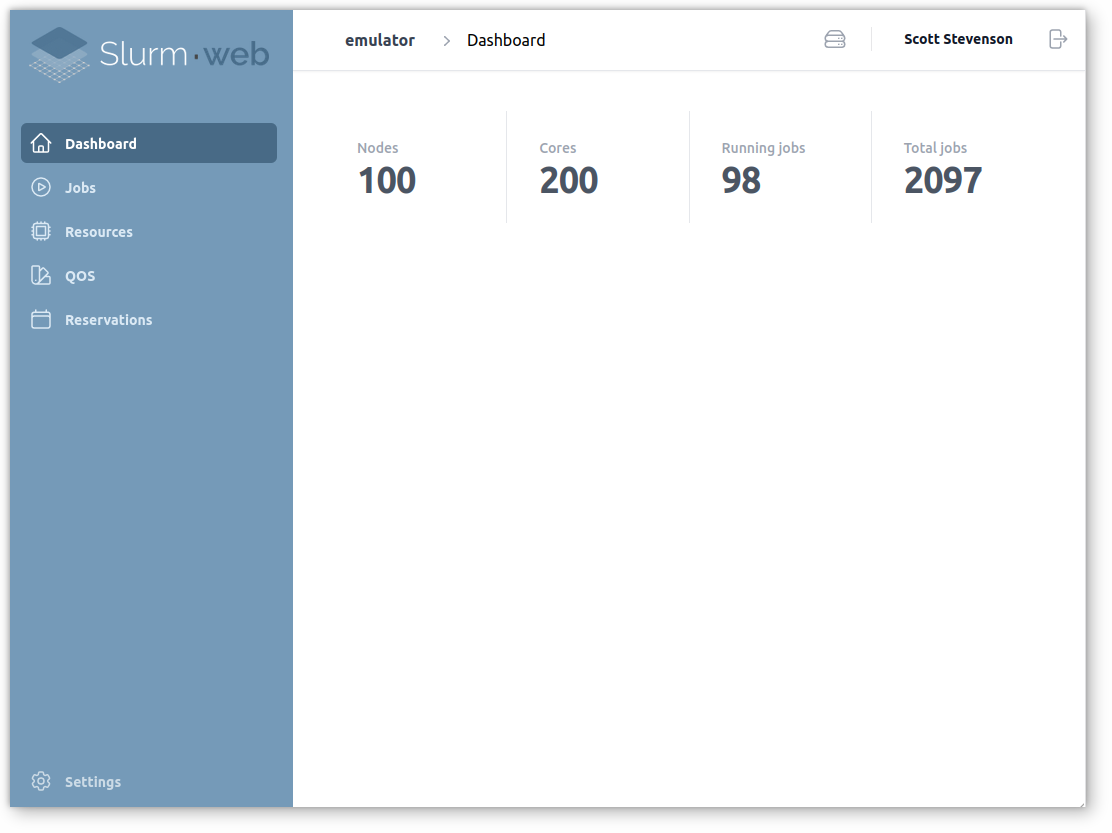
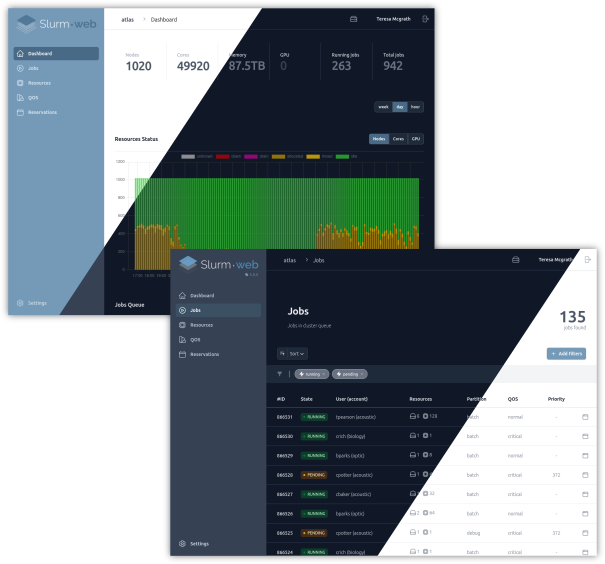
Dashboard
Slurm-web includes a dashboard with high-level metrics to get quick insight of HPC clusters status and operation:
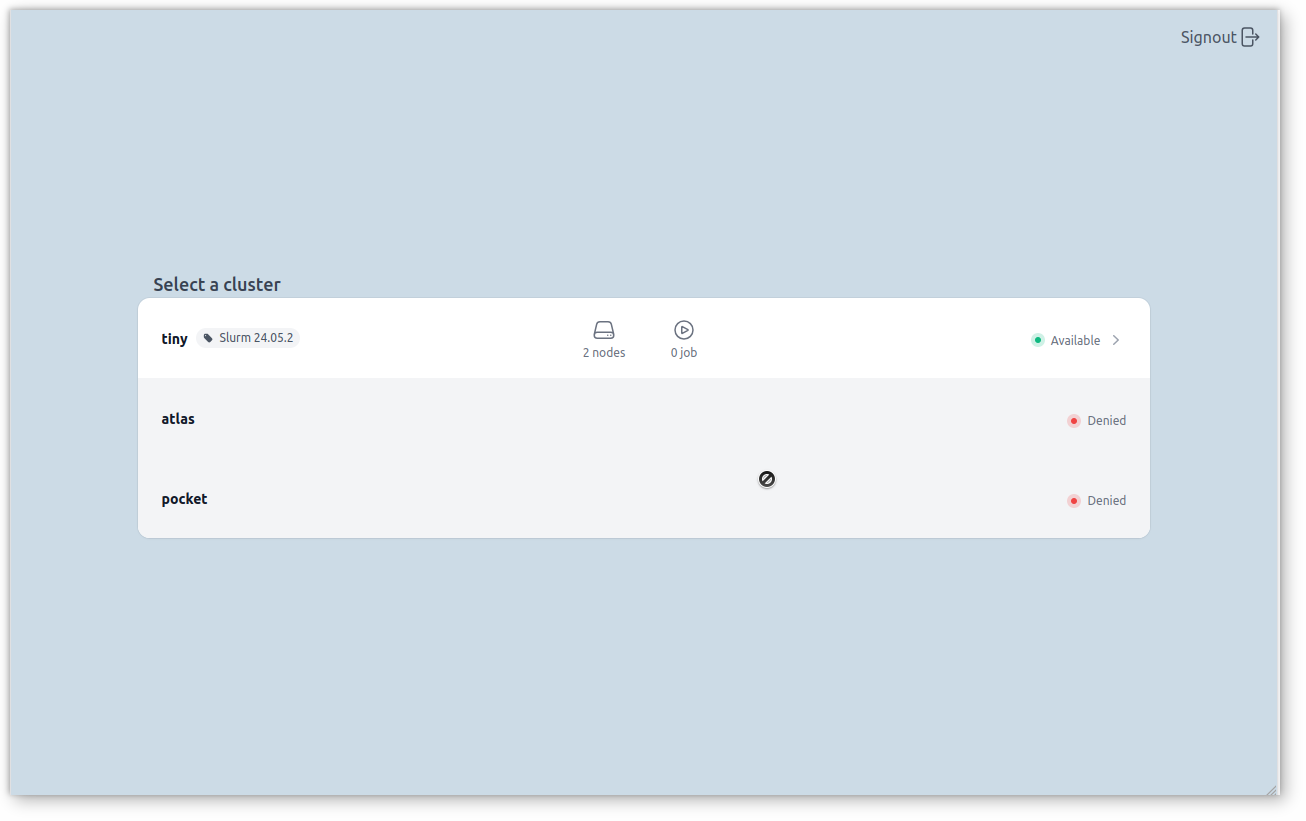
Multi-Clusters
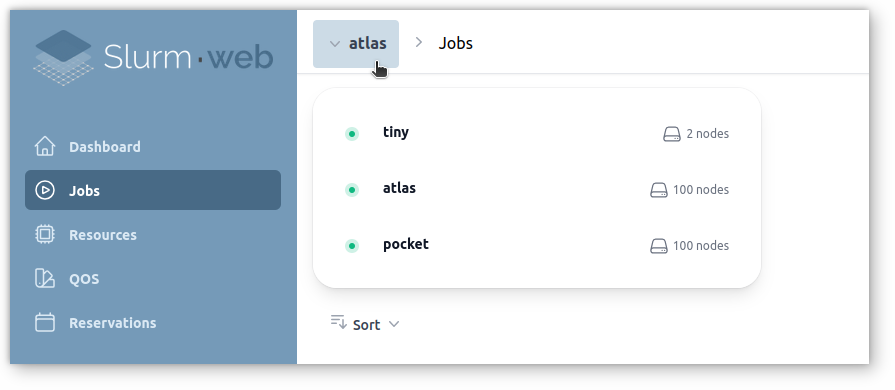
Slurm-web can be deployed on a central server to monitor all HPC clusters in your organization from a unique interface.
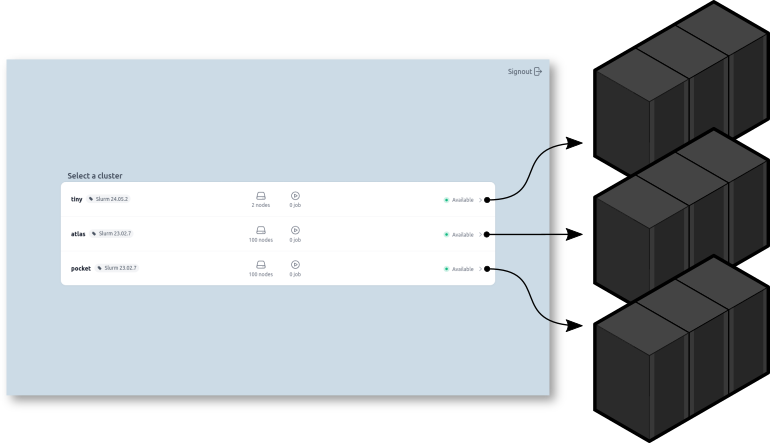
From anywhere in the interface, you can jump to another cluster and easily compare there statuses:
Jobs Status
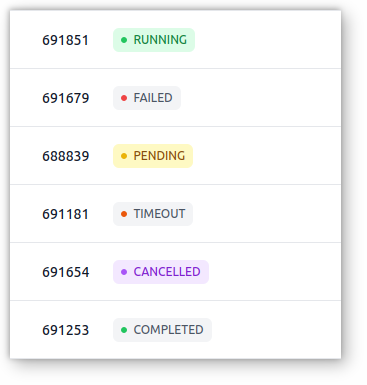
Easily visualize jobs status with colored badges and quickly spot possible failures.
Slurm-web represents Slurm jobs status with a visual colored badge. This really helps to figure out status of the jobs queue at a glance. Never miss errors when they occur!
Jobs filters and sorting
Jobs queue can be filtered by many criteria (job state, user, account, QOS, partition) and sorted by priority, ID, state, user, etc…
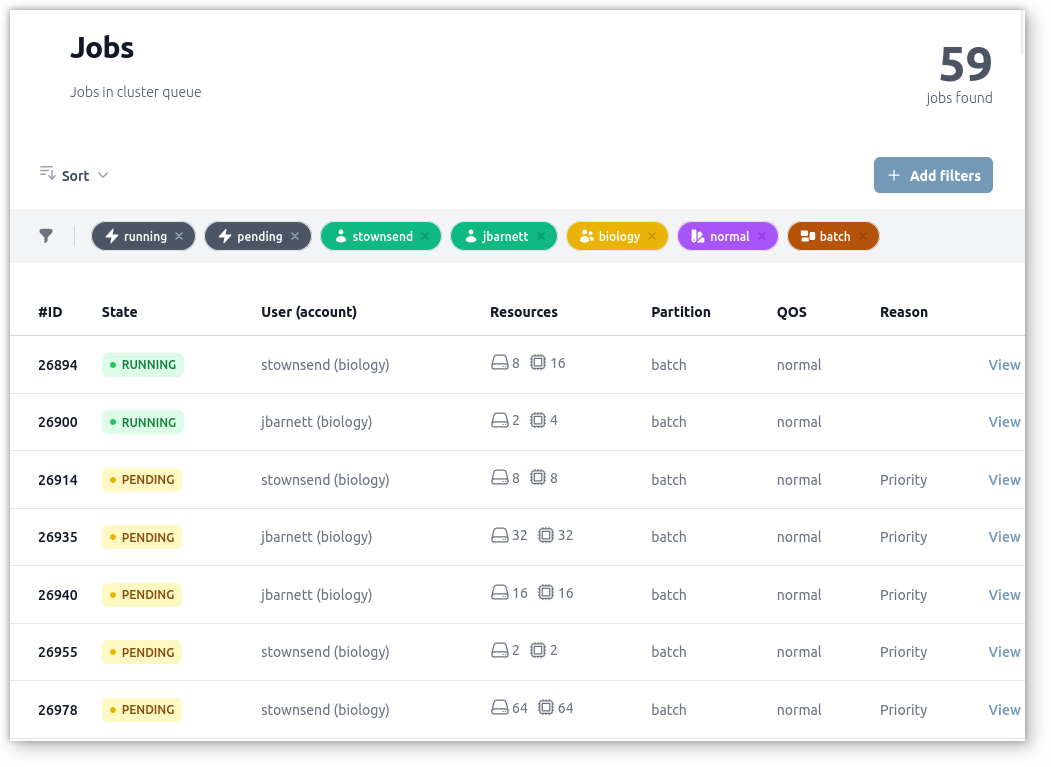
Filters can be applied and removed instantly with just a few clicks. It becomes really trivial to observe specific job flows and better understand Slurm scheduling.
Live Jobs Status
Slurm-web gives the possibility to track specific jobs during their lifetime with live updates:
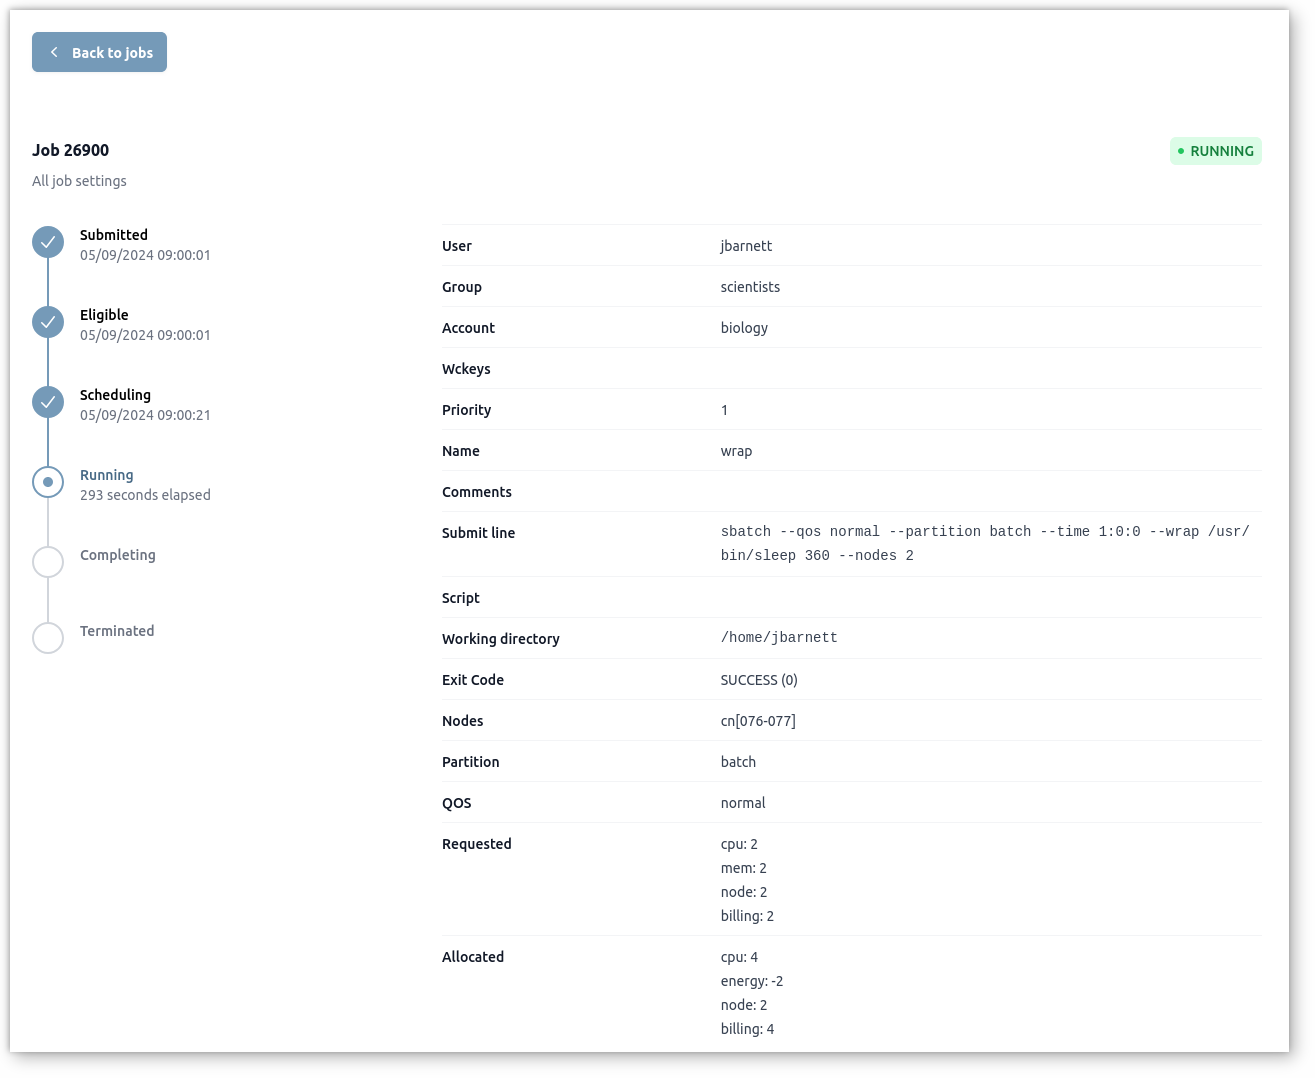
Watch your jobs running with visual representation of their progress.
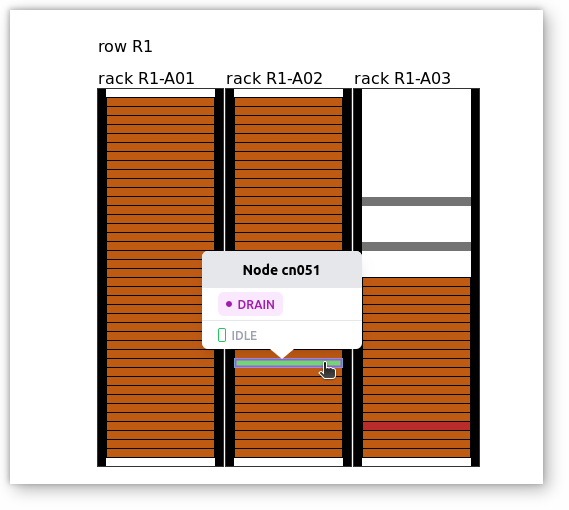
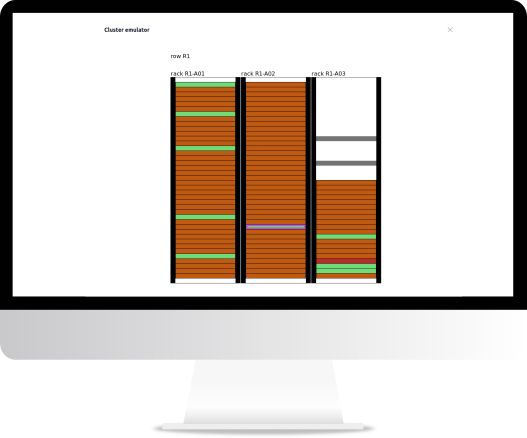
Nodes Status
Live status of the compute nodes can be visualized in an advanced interactive graphical representation of the racks based on data extracted from RacksDB. Just move the mouse pointer over a specific node to get all details:
Filters can be applied to quickly figure out nodes out of production:
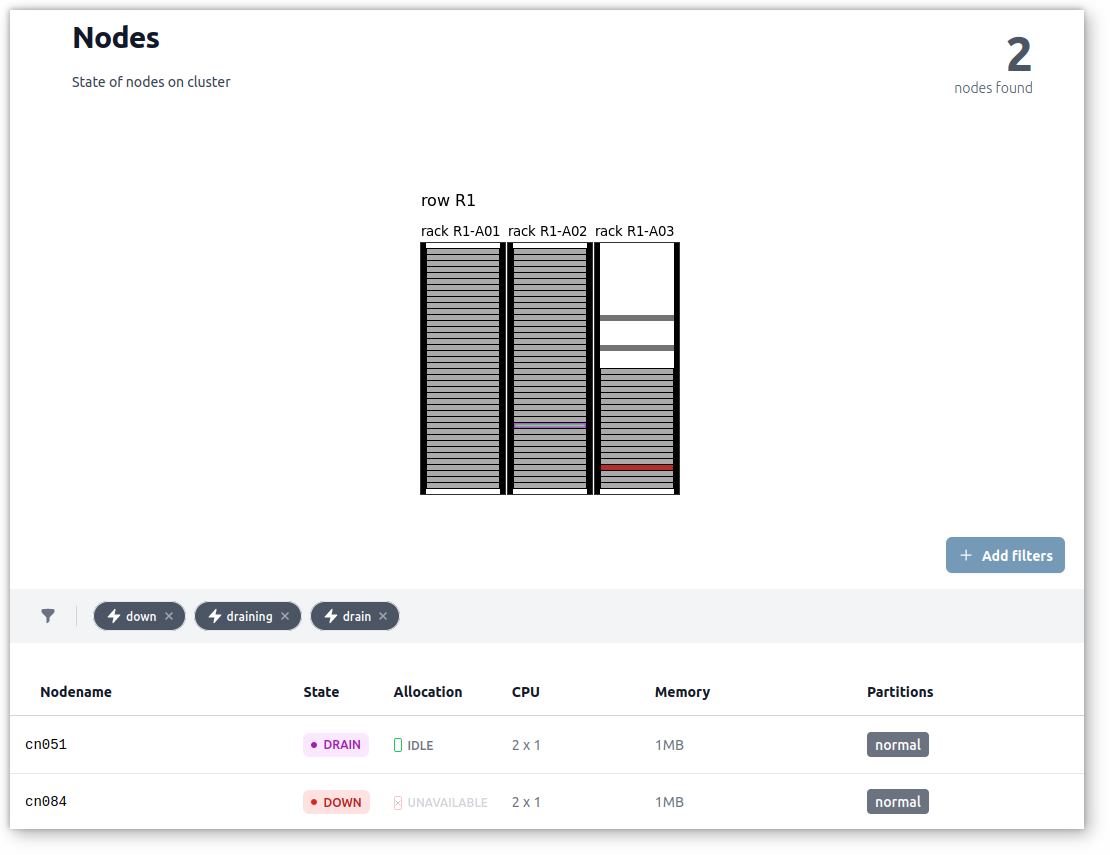
The cluster status can be displayed in fullscreen to get constant overview of its health and activity.
Cores Allocations
Slurm-web provides a more detailed and in-depth view of CPU cores usage and allocations compared to the global nodes status overview. This feature offers granular visualization of core allocation rates across compute nodes.
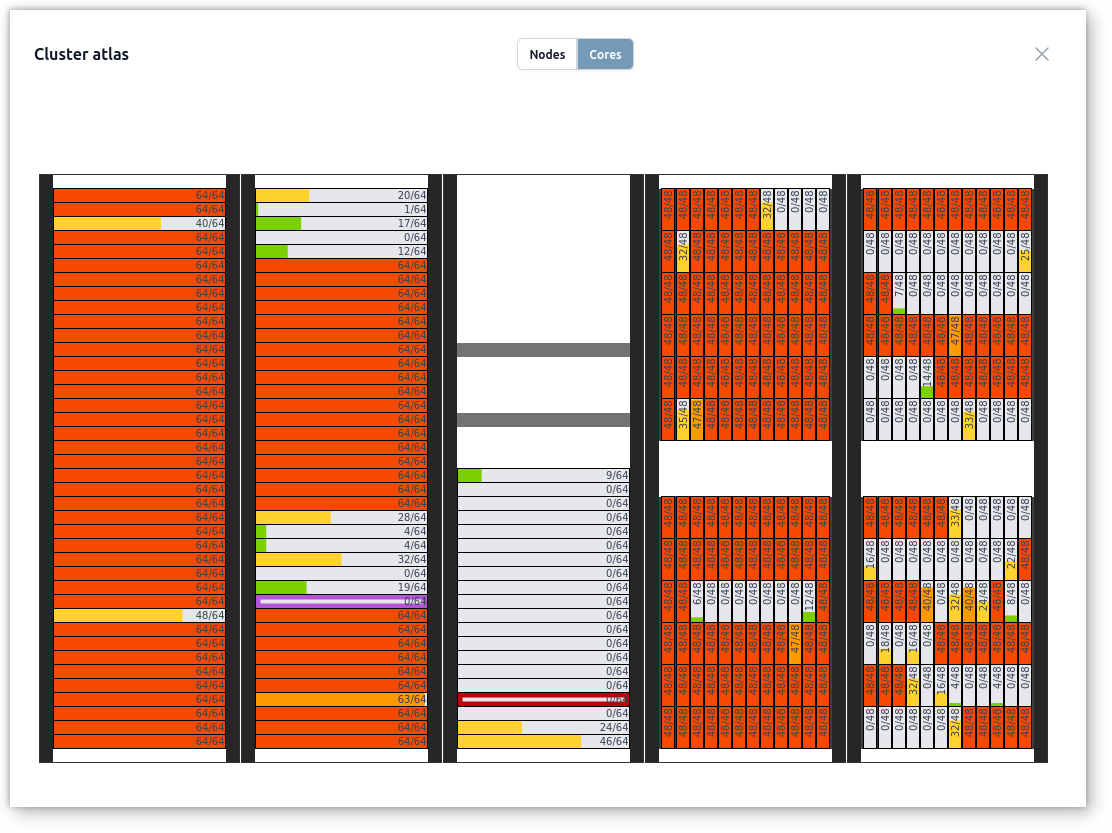
The interface displays real-time information about how many cores are allocated versus available on each node, providing a comprehensive view of resource distribution. While offering detailed insights into individual node utilization, it also allows users to get the overall cores usage level at a glance.
GPU Support
Slurm-web provides advanced support for GPU resources, offering a visual and intuitive interface to monitor and manage GPU usage across the cluster. It displays real-time information and metrics on GPU availability and allocation per node, making it easy to track how GPU resources are being used by jobs.
This feature is especially beneficial for AI and Machine Learning workflows, where efficient access to and monitoring of GPU resources is critical. Data scientists and ML engineers can quickly identify available GPUs, monitor job-specific GPU usage, and troubleshoot — without needing deep knowledge of Slurm’s CLI commands. This streamlined visibility significantly improves productivity and resource efficiency in GPU-accelerated workloads.
Account Hierarchy
Slurm-web provides an interactive accounts page that displays the account hierarchy for each cluster. This feature enables users and administrators to:
-
Visualize Account Structure: Display parent/child account relationships in a tree view, helping users and admins understand project or organizational hierarchies at a glance.
-
Intuitive Insights: Inspect account-specific information, such as resource limits with visual representation of their overrides, associated users, and QOS assignments, directly from the interface.
-
Easy Navigation: Links allow you to traverse account structures, with users and their associations.


The accounts interface streamlines account management, improves clarity into Slurm account policies, and reduces the need for complex CLI queries.
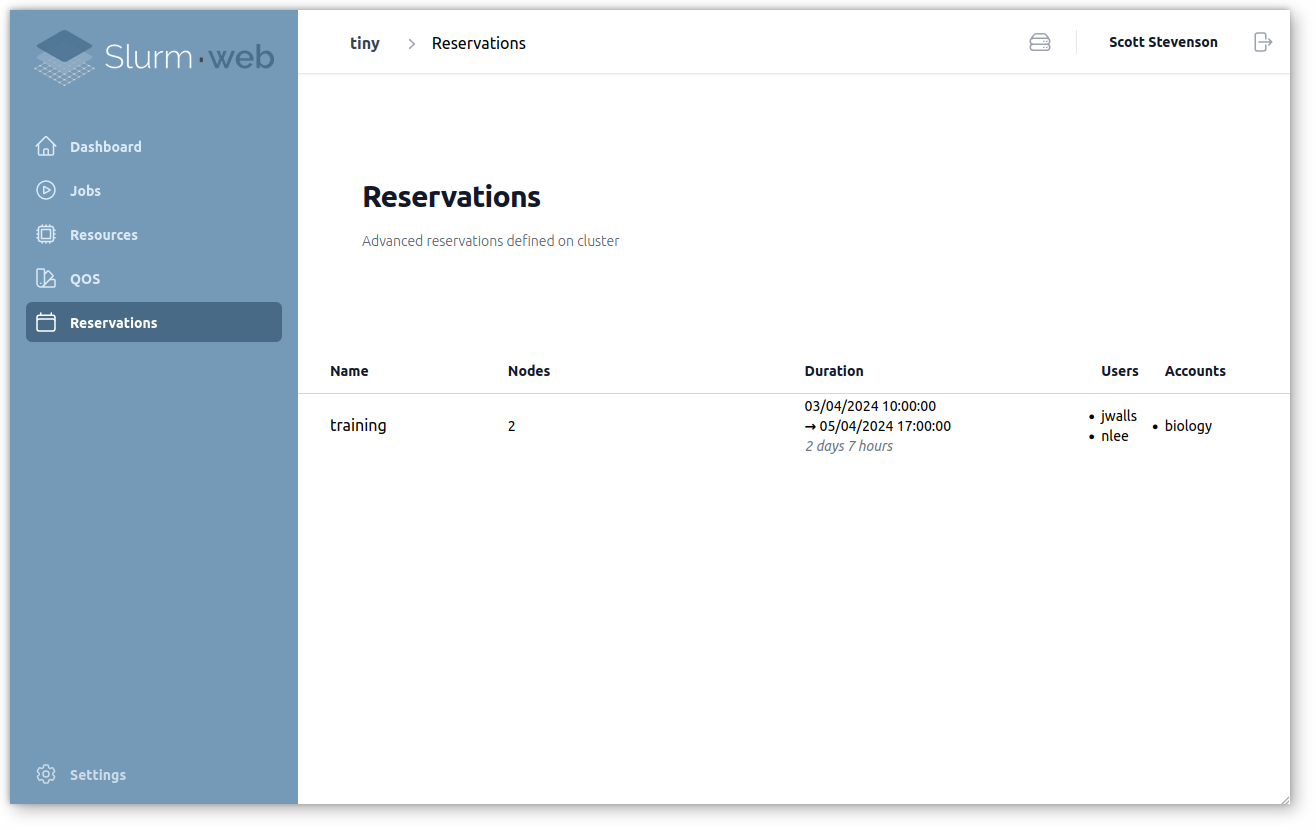
Advanced Reservations
Resources can be pre-allocated for a particular usage in Slurm with advanced reservations. Slurm-web displays these reservations with their resources, duration, authorized users and accounts:
QOS
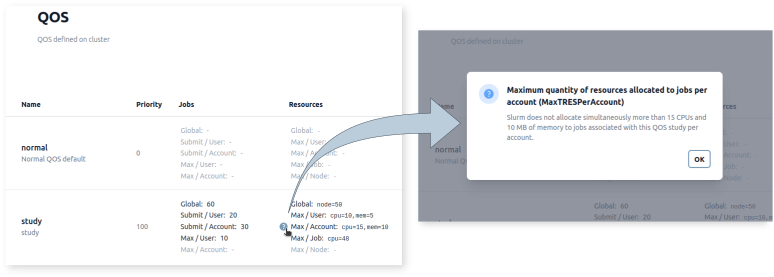
Slurm supports QOS with many features and plenty of parameters. Slurm-web displays the defined QOS in a synthetic way:
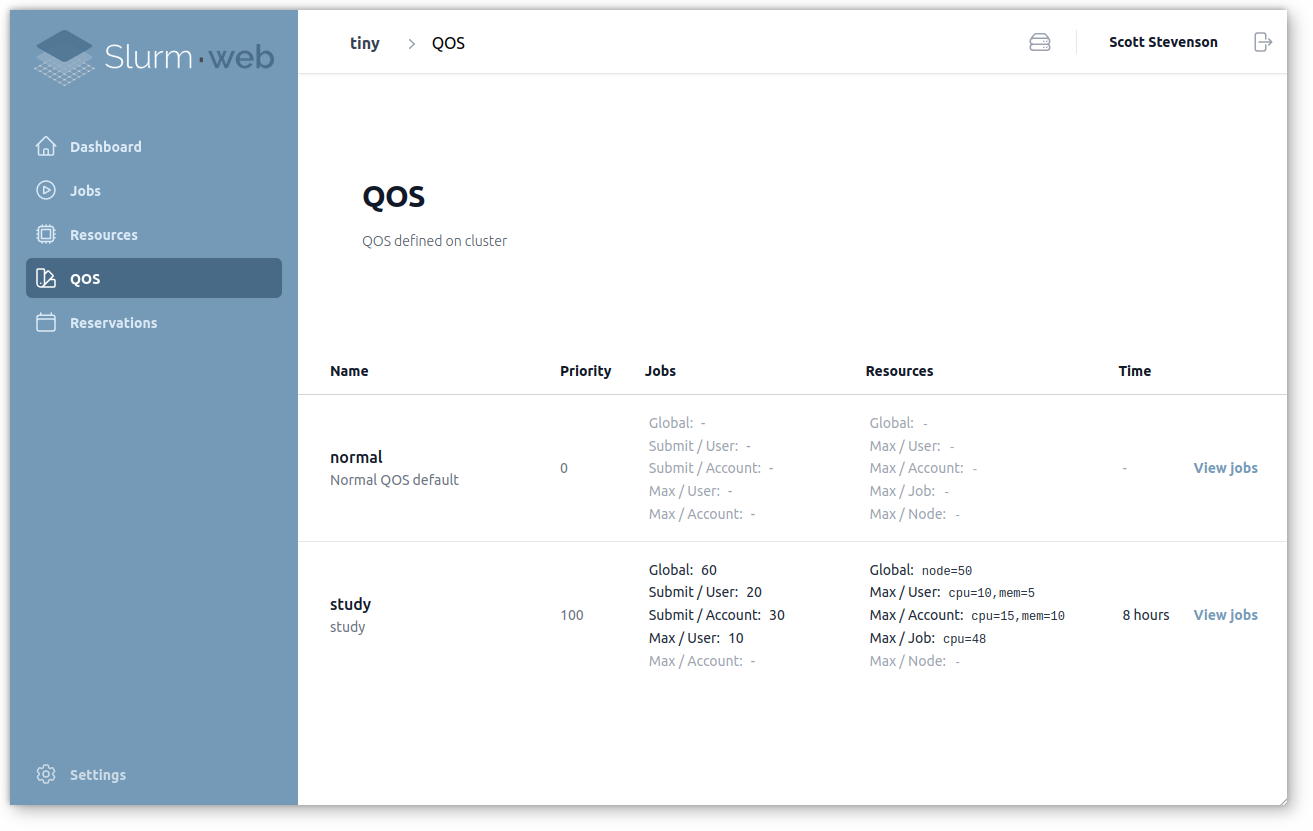
It becomes easy to spot differences between QOS and change limits to adjust the scheduling policy. The user interface includes built-in help messages to easily understand involved limits:
Reactive
Slurm-web interface is continuously updated in near real-time with fresh data fetched from clusters. Tables and diagrams are updated atomically with latest changes. You never need to reload pages.
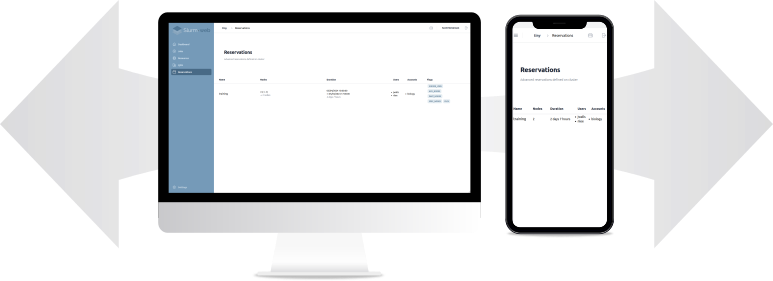
Responsive
Slurm-web interface is designed to be accessible on all devices, from smartphones to largest desktop screens.
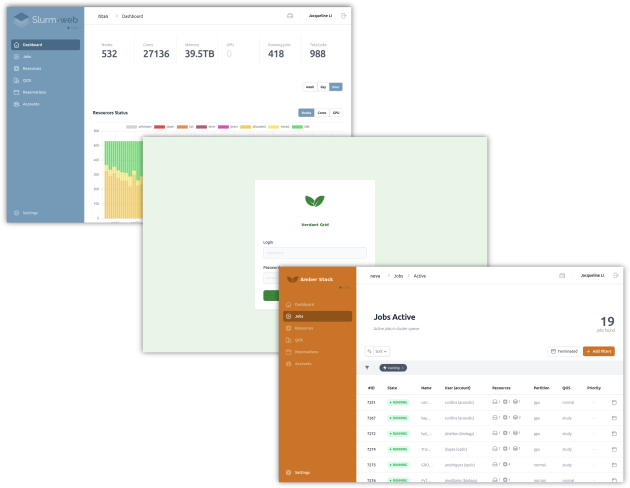
Dark Mode
Slurm-web includes native support for dark mode web interface. This feature enhances the user experience by reducing eye strain in low-light environments and aligning with system-wide appearance preferences.
The dark mode is automatically applied based on the user’s operating system or browser theme settings. Dark mode affects all interface components, including dashboards, job and node views, charts, and menus, ensuring consistent and accessible contrast across the application.
Custom Branding
Sites can customize the user interface appearance with their own brand colors, logos, and favicon. Colors are applied across the interface (sidebar, buttons, login page, menus). Separate logo images are supported for light and dark modes on the login page and in the sidebar.
Enterprise Authentication
Slurm-web supports user authentication with enterprise LDAP directories (FreeIPA, Active Directory, OpenLDAP, etc.) and single sign-on (SSO) with OpenID Connect identity providers (eg. Keycloak or Authentik).
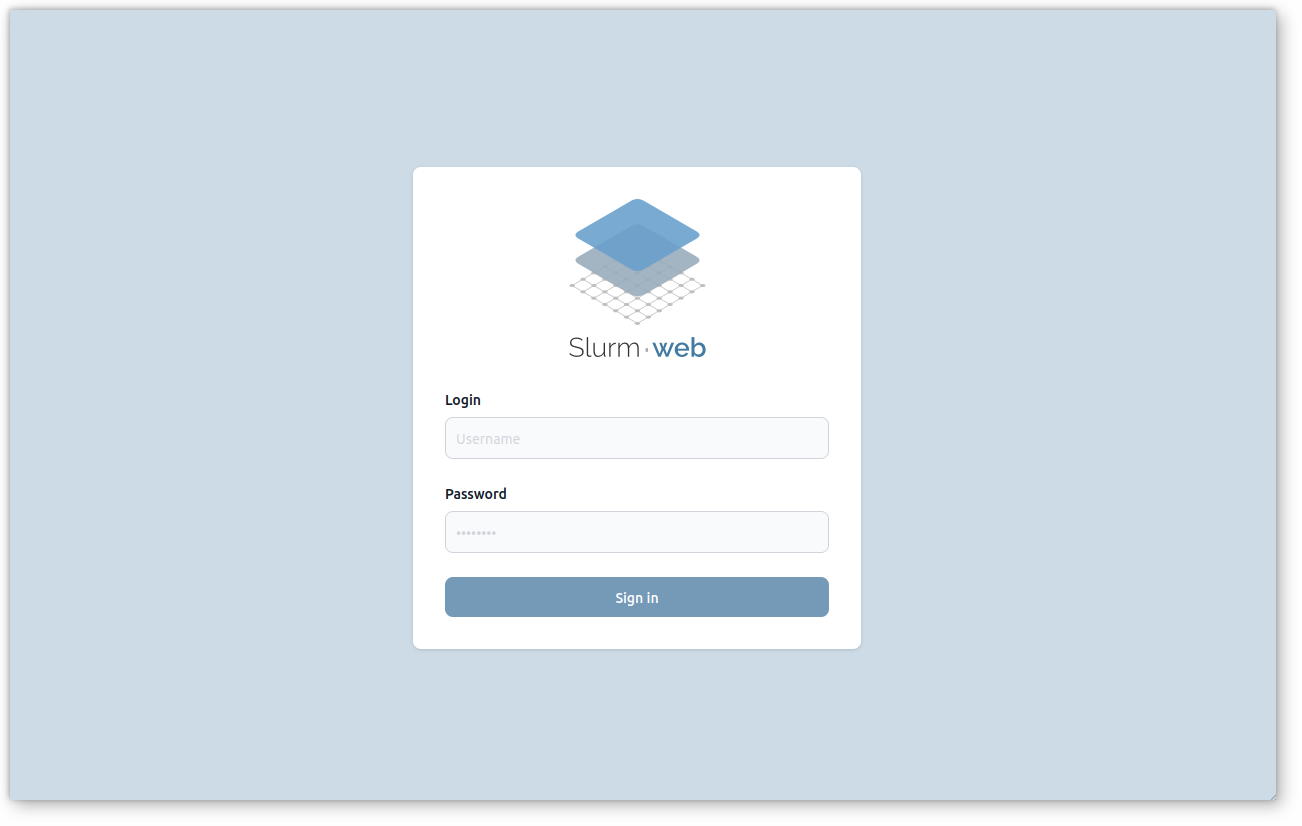
Access can be restricted to specific groups of users.
Advanced RBAC Permissions
Administrators can define advanced authorization policy based on roles (RBAC) and LDAP groups to control all users permissions in Slurm-web.
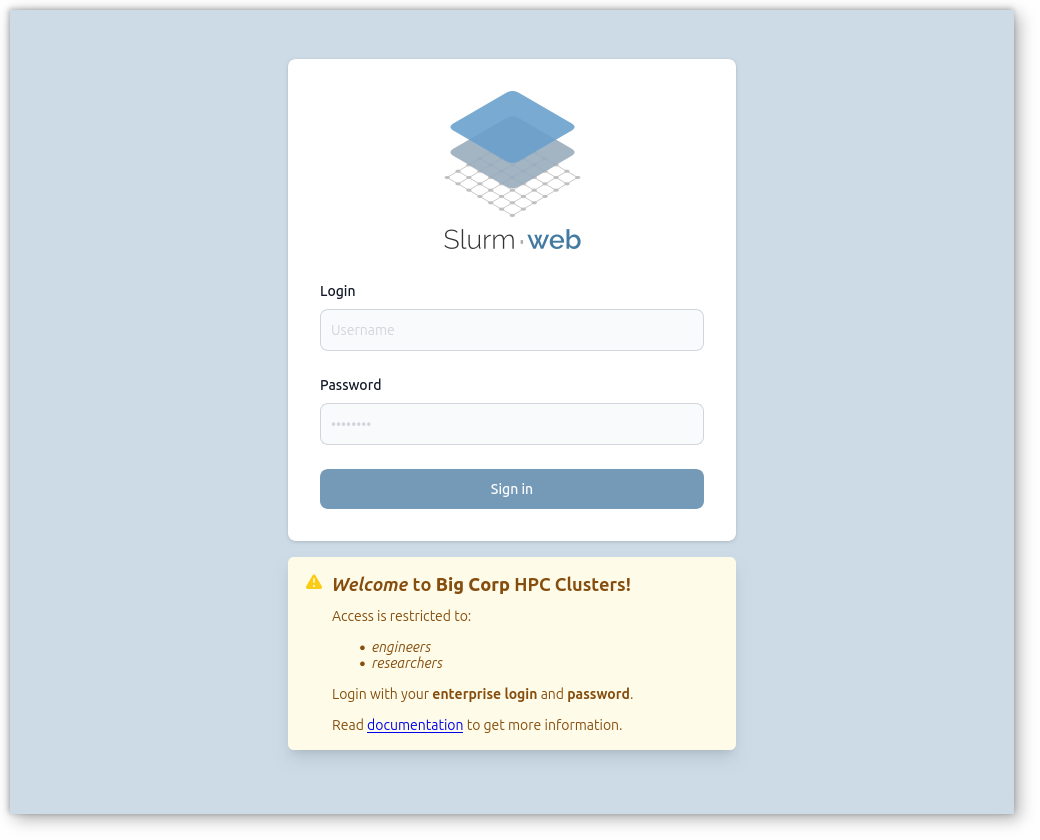
Custom Service Messages
Integrate custom service message directly in Slurm-web interface to communicate efficiently with users:
Transparent Caching
Slurm-web can use Redis in-memory database to cache Slurm status, in order to maximize performances and significantly reduce load on Slurm scheduler.
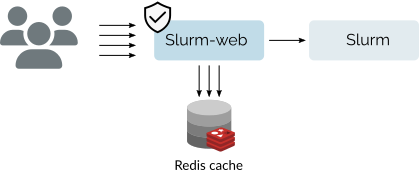
Users are able to track jobs list in near real-time very efficiently. Finally
drop the load generated by infinite loops of squeue!
Metrics
Slurm-web is designed to integrate with Prometheus (or any compatible solution) to manage many Slurm metrics.

Metrics of the computing resources statuses and the jobs are exported in standard OpenMetrics format, designed to be collected by Prometheus and stored in timeseries database. Slurm-web query this database to produce charts with these metrics.
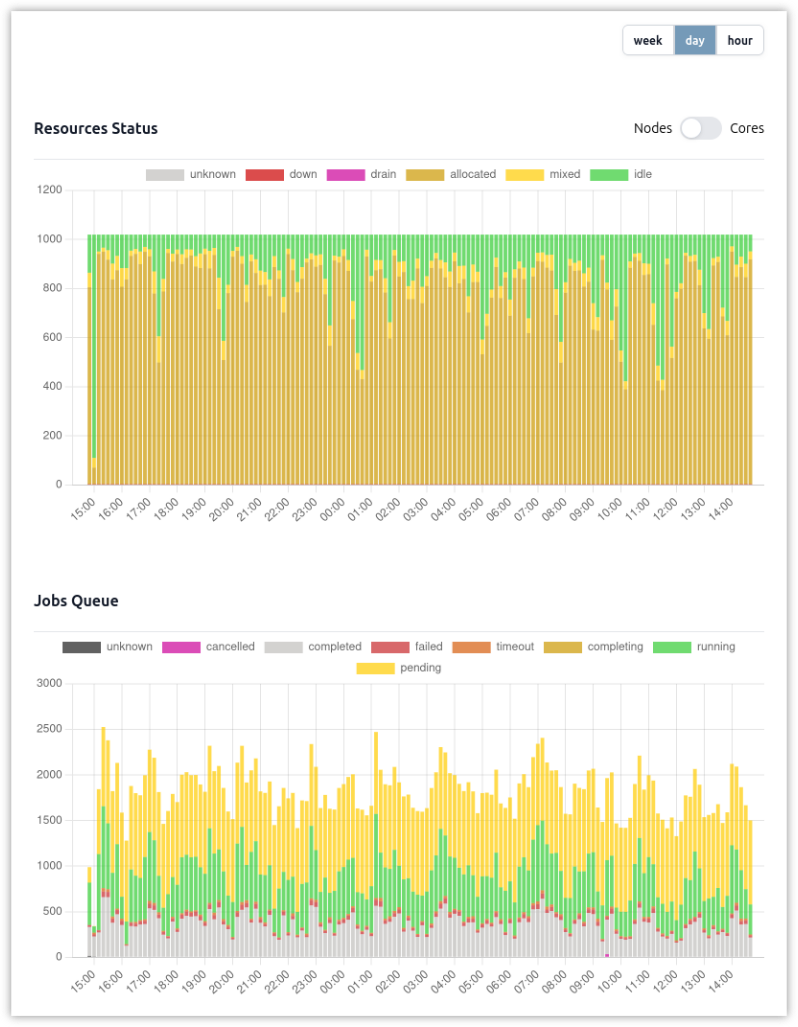
These graphs give you a clear view of the evolution of the state of your production HPC clusters.